
CLM Metrics and ROI Measurement That Actually Work
Master CLM metrics and ROI measurement with proven formulas, benchmarks by function, and dashboards that prove value to every stakeholder.

Tired of nonsense pricing of DocuSign?
Start taking digital signatures with BoloSign and save money.
A widely cited composite analysis of enterprise AI contract lifecycle management deployments reported 261% average three-year ROI, a 13.8-month payback period, and $4.2 million in three-year net present value for a mid-enterprise processing about 800 contracts annually. Those figures are useful, but they also create a trap. A headline ROI number won't survive a CFO review unless the team can show which value came from faster work, which came from recovered revenue, and which represents risk avoided rather than cash realized. (AI CLM ROI analysis)
I've built CLM measurement frameworks across three companies, and the same pattern appeared each time. Legal teams tracked approval speed, sales tracked signed agreements, and operations tracked adoption. Finance wanted a defensible bridge from those activities to margin, revenue protection, and investment cost. This guide lays out a practical model for CLM metrics and ROI measurement, including partial-adoption rollouts, confidence levels, dashboards, and the workflow data required to support every claim.
Why Most CLM ROI Numbers Fail to Convince
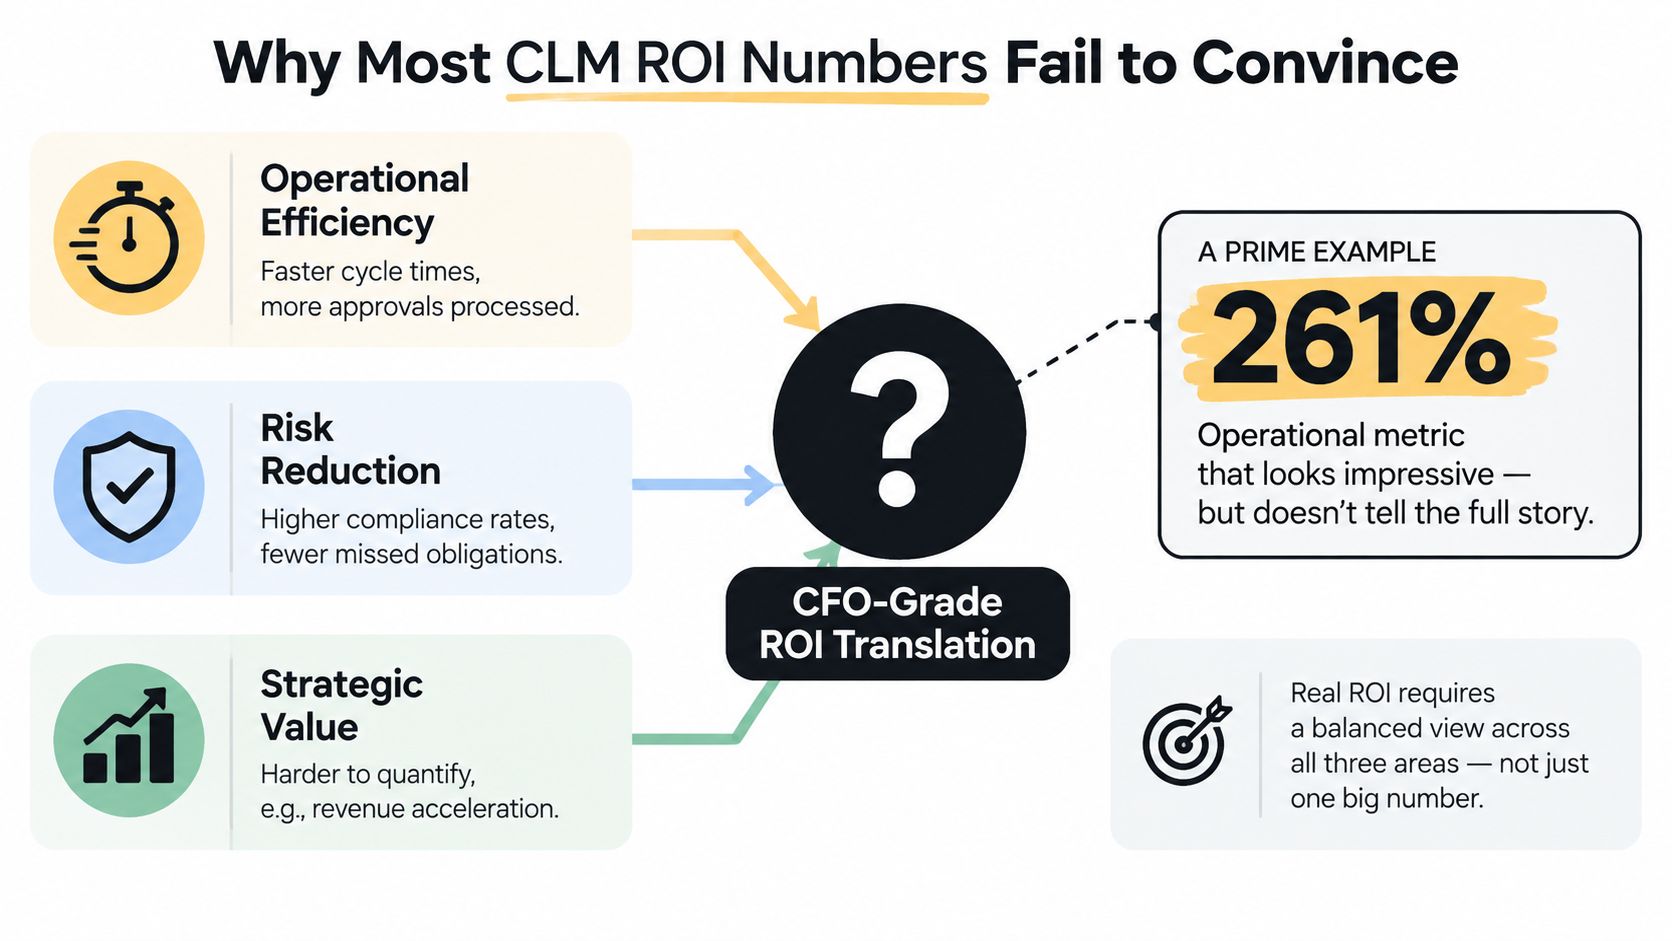
A 261% three-year ROI benchmark is a reference point, not a promise. It came from a 2025 Forrester-style composite analysis of 14 enterprise AI CLM deployments across financial services, manufacturing, healthcare, and technology. The analysis used ROI, payback, and NPV, the measures CFOs recognize. Internal dashboards often stop earlier, reporting activity without showing how that activity affected money, capacity, or exposure.
A dashboard can show more contracts processed, faster approvals, and stronger compliance. Those outcomes matter, but they do not answer the budget question: what financial value did the company create, protect, or avoid losing? Higher contract volume may reflect more low-value agreements. Faster approval may improve the user experience without changing revenue, cost, or risk.
Four reasons dashboards lose credibility
Vanity KPIs replace financial outcomes. Contracts signed, templates published, and clauses standardized show activity. They provide weak ROI evidence until the team connects them to cost per contract, renewal capture, discount control, or reduced exposure.
The pre-CLM baseline is missing. Without first-draft-to-signature timestamps, administrative effort, leakage records, and pre-implementation compliance results, the team relies on memory. Finance cannot validate an improvement without a documented starting point.
Functions count the same gain twice. Legal may claim hours saved through fewer redlines while sales claims those hours as faster deal progression. Both can report the operational effect, but the enterprise model must assign the financial value once.
Risk avoidance is reported as realized savings. Preventing a possible dispute does not recover cash. Estimate the probability-weighted expected loss, label the confidence level, and keep worst-case exposure separate from booked value.
Practical rule: A useful CLM metric shows what changed. A credible ROI metric shows why that change affected money, risk, or capacity.
Use three value categories: process efficiency, revenue acceleration, and risk avoidance. Assign confidence separately. Process efficiency usually earns high confidence when workflow timestamps and labor baselines exist. Revenue acceleration needs medium confidence unless contract timing connects directly to booked revenue. Risk avoidance usually carries lower confidence because the prevented event did not occur.
For a detailed view of cost categories affecting an e-signature and CLM program, use this e-signature platform total cost of ownership analysis. The dashboard should state which workflow created measurable value, which evidence supports the claim, and which portion remains an assumption. Partial adoption can still support a credible case when the model limits attribution to instrumented processes and labels the rest clearly.
The Four Baseline Streams That Build a Real ROI Model
A credible CLM ROI model separates process efficiency, revenue acceleration, and risk avoidance. Build four baseline streams within those categories: cycle time, administrative hours, revenue leakage, and compliance or risk avoidance. Give each stream its own baseline, formula, owner, and confidence level. A single productivity percentage will not survive budget review.
1. Cycle time reduction
Record the days from first draft to signature, then estimate recovered capacity:
(days saved × contracts per year × loaded hourly rate) ÷ 2,080
The 2,080 denominator converts time into annual labor capacity. It does not prove cash savings. Call the result capacity value unless the company removes external spend, avoids hiring, or redeploys the time to revenue-producing work. Confidence is high when workflow timestamps and labor baselines agree, and medium when the organization has not documented how capacity changes.
2. Administrative hours eliminated
Measure manual work around intake, routing, filing, renewal tracking, status requests, and document retrieval. Apply the fully loaded labor rate, then assign the value to the function that releases the time.
Benchmark guidance reports 20% to 30% administrative cost reduction and 50% to 70% legal review-time reduction when workflows are standardized and instrumented end to end. (CLM ROI benchmark methodology) Treat this stream as high confidence only when time studies and workflow logs support the same baseline. Otherwise, report it as an estimate.
3. Revenue leakage recovery
Revenue leakage includes missed renewals, uncaptured escalators, pricing drift, and unapproved discounts. Suppose a CLM workflow protects a 5% escalation on a $2 million contract. The gross protected value is $100,000, but credit the model only for the amount connected to a documented workflow event, such as an alert that prompted renewal or corrected pricing.
This stream supports revenue acceleration, not general productivity. Confidence is high when the contract event links to an invoice, renewal, or booked revenue. Use medium confidence when the workflow identifies exposure but the financial outcome requires another team's action.
4. Compliance and risk avoidance
Estimate the likelihood of an adverse event, its financial impact, and the share a CLM control could realistically prevent. Do not count an entire hypothetical penalty, dispute, or operational failure as savings. Risk avoidance normally carries lower confidence because the prevented event never occurred. Keep expected value separate from worst-case exposure.
A mid-market SaaS company processing 800 contracts annually may model $1.4 million in measurable value across these streams, provided supporting records exist and implementation and run costs are deducted. Faster signing earns ROI only when the saved time changes capacity, accelerates a revenue event, reduces cost, or supports a defensible risk outcome.
| Baseline Stream | Formula Components | Confidence Level |
|---|---|---|
| Cycle time | Days saved × annual contract volume × loaded hourly rate ÷ 2,080 | Medium unless capacity is redeployed or cost is removed |
| Administrative hours | Hours eliminated per contract × annual volume × fully loaded labor rate | High when time studies and workflow logs agree |
| Revenue leakage | Recovered renewal, escalation, pricing correction, or discount control tied to a contract event | High when the event is traceable, otherwise medium |
| Compliance and risk avoidance | Probability of loss × financial impact × preventable share | Medium or low unless controls and outcomes are documented |
Instrumenting Data Collection Across the Contract Lifecycle
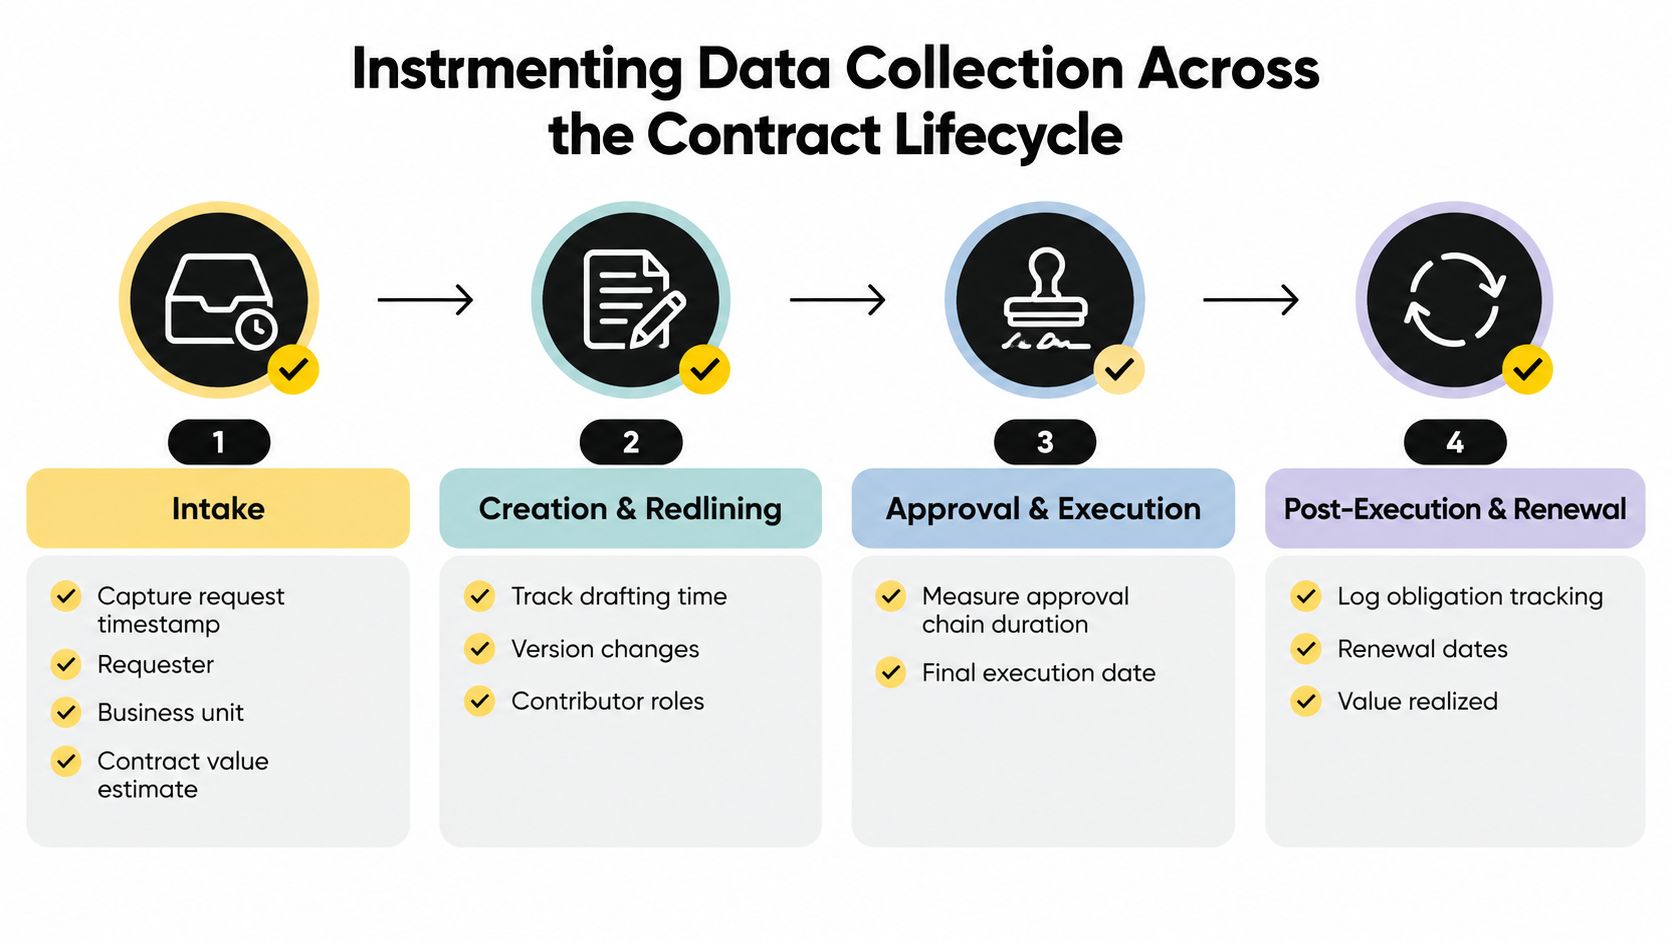
ROI models fail at the event level. If intake, redline, approval, and signature timestamps are missing or inconsistent, the team can't calculate cycle time reliably. Every transition needs an immutable event, a responsible identity, and a clear definition of when the clock starts and stops.
Capture the workflow in four stages
Intake should record the request timestamp, requester, business unit, contract value estimate, contract type, and deal priority. Pull CRM opportunity data where possible, and make the intake form the controlled source for work that doesn't originate in sales.
Drafting and redlining should preserve the template version, selected clauses, deviation flags, contributor roles, document versions, and collaboration events. These fields let legal distinguish a standard agreement from a heavily negotiated one.
Approval and execution require redline turns, counterparty responses, approval-chain duration, SLA breaches, signature events, signer identity, and signing method. For teams that need fast execution, e-signature workflows can create and send PDFs, templates, and forms instantly, then track the exact execution event instead of relying on an email trail. Under the U.S. ESIGN Act, an electronic contract or signature can't be denied legal effect solely because it's electronic, and valid e-signatures need intent, consent, linkage to the record, and retention or reproducibility. (U.S. ESIGN requirements)
Post-execution starts with the executed copy. Use OCR when necessary, extract term, value, renewal date, governing law, obligations, and approval exceptions, then connect those records to renewal and obligation tracking.
For a broader operational view of lifecycle workflows, see this guide to CLM software. Integrations should also capture CRM opportunity close dates, ERP purchase-order values, SSO identity for audit trails, and BI export pipelines. BoloSign can create, send, and sign PDFs, templates, and forms online, with AI-powered contract workflows, secure eSignature, reporting support, and controls relevant to ESIGN, eIDAS, HIPAA, and GDPR. Teams in staffing, healthcare, real estate, logistics, education, and professional services can use those records to connect digital signing solutions to contract outcomes.
The seven elements no measurement program can operate without are:
- Unique contract ID: Connects every event and document version.
- Contract type: Enables comparisons between staffing agreements, healthcare forms, leases, vendor contracts, and other workflows.
- Business owner: Assigns accountability for value and follow-through.
- Event timestamps: Establishes the clock for cycle-time calculations.
- Contract value: Supports revenue and procurement analysis.
- Renewal and obligation dates: Enables leakage and compliance tracking.
- Source system identity: Preserves auditability across CRM, ERP, CLM, and BI.
The following video offers a practical visual complement to the event model:
Benchmarks and KPIs by Function Sales Procurement and Legal
Each function needs a focused scorecard tied to the outcome its leader must defend. Sales tracks whether agreements support committed close dates. Procurement measures controlled spend and captured commercial value. Legal measures review capacity, deviation quality, and monitored obligations.
Use shared event definitions, but do not force one enterprise KPI across all three teams. Separate process efficiency, revenue acceleration, and risk avoidance, then label the confidence each metric can support. That distinction lets a partial-adoption rollout prove value without overstating financial impact.
| Function | Primary KPIs | Cycle-Time Baseline | Year-1 Target | Defensible Outcome Metric |
|---|---|---|---|---|
| Sales | Approval turnaround, contract velocity against committed close date, ramp-to-first-contract | Use CRM and CLM timestamps for the current workflow | Reduce avoidable approval delay and improve contracts closed before the committed date | Revenue acceleration tied to a signed contract and documented close-date movement |
| Procurement | Sourcing cycle, maverick-spend rate, rebate-capture completeness | Compare sourcing request to executed supplier agreement | Standardize intake and improve visibility into supplier terms | Controlled spend, captured rebates, and corrected commercial terms |
| Legal | Redline turnaround, clause-deviation rate, obligation-extraction accuracy | Measure first legal review through approved execution | Reduce review friction while preserving playbook controls | Risk-adjusted legal capacity and documented obligation coverage |
Set year-one targets from your own baseline. External benchmarks are directional only. A benchmark set reports 40% to 55% cycle-time reduction from a 30-to-45-day baseline, with compliance moving from 75% to 85% toward 95% or higher after workflow standardization and instrumentation. Use that range to test whether your target is plausible, not to promise an outcome. (Contract management ROI benchmarks)
What each function can defend
Sales can defend a process-efficiency claim when approval timestamps show less delay, and a revenue claim when a signed contract connects to a documented close-date movement. That revenue evidence deserves higher scrutiny than cycle-time evidence.
Procurement can defend recovered value when a supplier term, renewal, rebate, or purchase order is tied to the CLM workflow. Legal can defend hours saved and reduced deviation risk when the system records the work, preserves approvals, and shows which obligations received coverage.
Post-signature measures require ownership, not just extraction. Use contract obligation tracking and management to connect obligations, renewal dates, and owner actions to the original agreement. Keep the scorecard focused. Three to five KPIs per function are enough to guide decisions. More usually creates reporting volume without executive attention.
Attribution Confidence How to Avoid Overstating ROI
The most common CLM ROI error is attribution failure. A company launches CLM alongside CRM changes, pricing revisions, sales training, and new approval policies, then credits every improvement to the contract platform. The result may look precise, but the causation is weak.
Use three confidence levels and label every claim.
Level 1 identifies controllable events
This is the strongest level for direct process evidence. Examples include clauses captured, hours logged per contract, approval steps completed, templates used, and obligations extracted. These events show that the workflow changed, but they don't prove enterprise financial impact by themselves.
Level 2 supports causal efficiency claims
A Level 2 claim compares a CLM cohort with a comparable non-CLM cohort, or compares matched contract types before and after implementation. A cycle-time reduction is more credible when the contract mix, business unit, priority, and period are comparable.
Level 3 supports revenue attribution
Revenue claims need longitudinal evidence and counterfactual reasoning. A recovered rebate, prevented renewal miss, or corrected discount should connect to a specific contract workflow change and remain traceable through the renewal or billing event. Teams building more advanced models can use this guide to revenue tracking to strengthen the attribution discipline.
Consider a reported $1.2 million ROI. At Level 1, the company might credit the full amount based on logged activity and modeled capacity. A matched-control analysis could reduce the defensible value to roughly $480,000, while longitudinal revenue evidence and counterfactual review might leave about $220,000 at Level 3. Those figures are an illustration of confidence adjustment, not a benchmark. The important practice is to report the tier beside the claim so executives can distinguish measured activity from proven financial return.
Don't hide uncertainty. Label it, quantify the assumption, and show what evidence would raise the confidence level.
Building Dashboards and Reports Stakeholders Actually Trust
A dashboard earns trust when each audience sees the few measures it uses to make decisions. It loses trust when every function receives the same page of activity counts.
CFO view
Show an ROI waterfall, payback period, and cost per contract against baseline. Refresh weekly, and add one sentence explaining the driver, such as recovered renewals, lower external review cost, or capacity redeployment. The CFO should be able to trace each bar to a source record and a confidence tier.
CRO view
Prioritize time to signed agreement, ramp to first contract for new representatives, and the percentage of contracts closed before quarter-end. Refresh daily during deal-closing weeks. A sales leader needs to see whether contract friction is affecting committed revenue, not just whether the team sent more documents.
CLO view
Display obligation coverage, playbook deviation, and risk-adjusted approval-cycle time. Refresh monthly, with a short case note on the most material deviation. The note should state what happened, who approved it, and whether the business accepted a defined risk.
COO view
Track auto-adoption rate, escalation age, and workload distribution across contract managers. The COO needs to identify where work still leaves the controlled process and whether a small number of people are carrying the exception load.
Use the CLM as the system of record, export governed data to BI for visualization, and put one narrative slide beside each dashboard. The slide should answer three questions: what changed, why it changed, and what decision follows. This approach also supports digital signing workflows for teams that need to sign PDFs online, add signature to Google Form workflows through connected intake processes, and connect contract automation to CRM and operations.
BoloSign offers unlimited documents, templates, and team members at one fixed price, positioned as up to 90% more affordable than DocuSign or PandaDoc. (BoloSign eSignature ROI report) That commercial structure can simplify cost-per-contract modeling, but the dashboard still needs to separate subscription cost from implementation, integration, training, and ongoing operating costs.
A 30-60-90 Day Plan to Prove CLM Value
A measurement rollout should follow one complete renewal cycle, not a convenient reporting deadline. The first phase creates trustworthy events, the second creates comparable baselines, and the third turns the evidence into executive decisions.
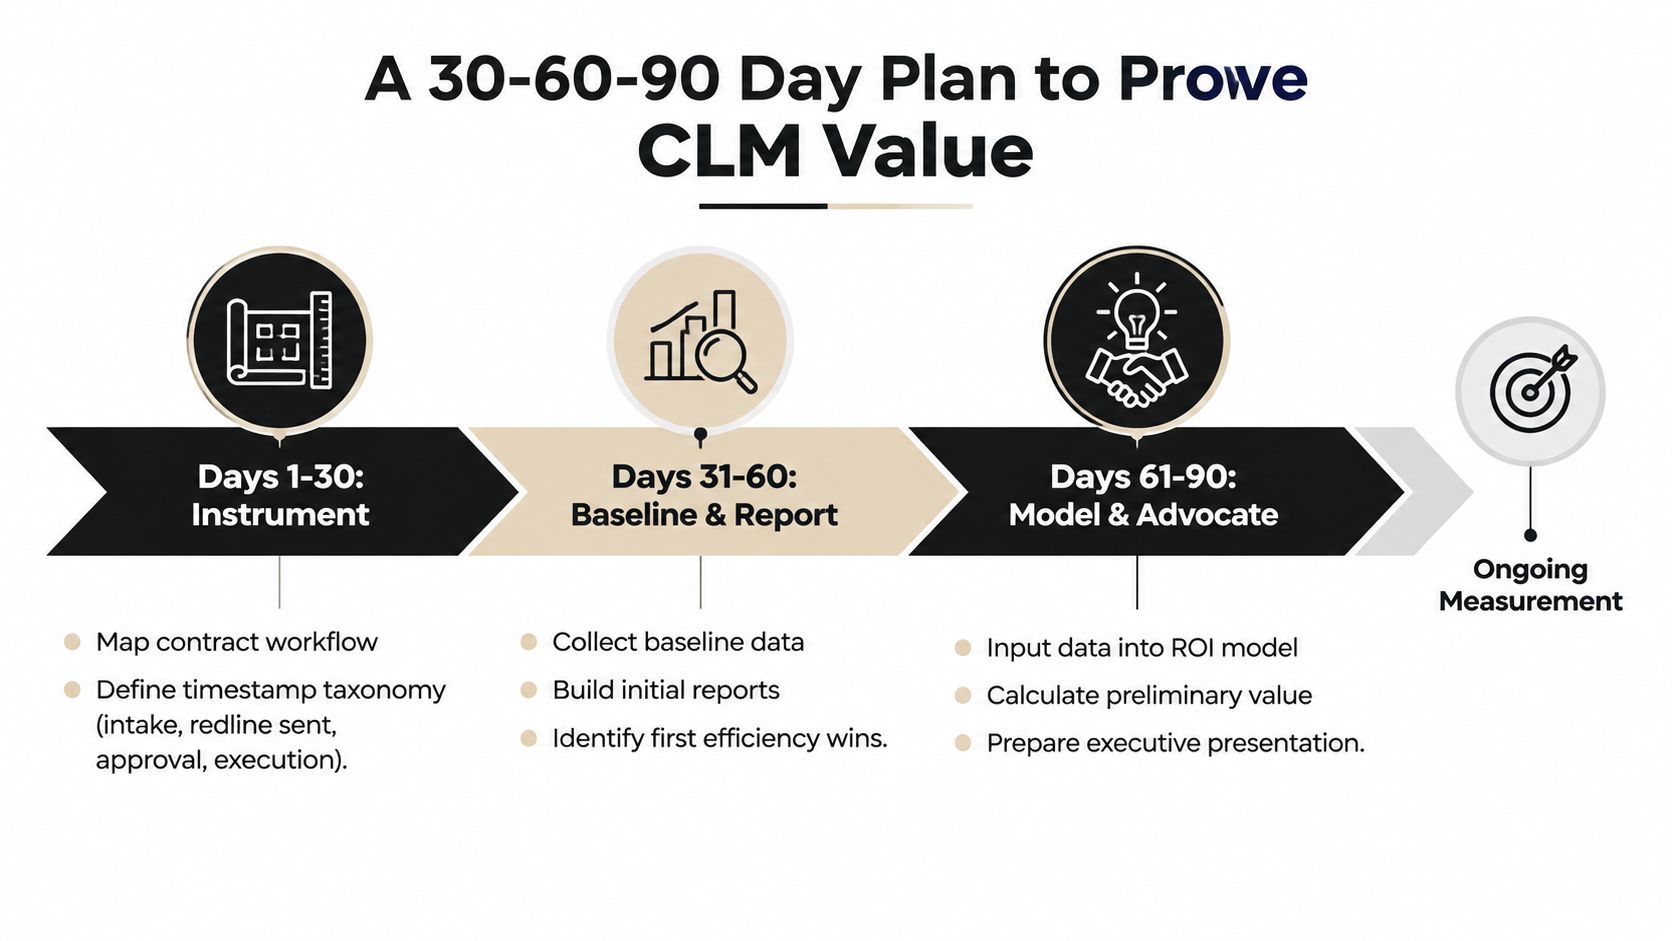
Days 1 to 30, instrument
Map one contract type from intake through renewal. Define the timestamp taxonomy, including intake, redline sent, approval, signature, and obligation creation. Stand up intake fields and CRM hooks, then verify a data feed before expanding scope.
Days 31 to 60, baseline
Pull 12 months of pre-CLM data and calculate the four ROI streams for each participating function. Set targets against the function comparison table, separating capacity value, realized savings, revenue recovery, and risk avoidance.
Days 61 to 90, report
Configure the CFO, CRO, CLO, and COO widgets, lock refresh cadences, and pre-write the narrative annotation for each view. During the closing week, deliver a stakeholder readout tied to renewal timing, with confidence labels beside every value claim.
| Phase | Owner | Output | Go or No-Go Gate |
|---|---|---|---|
| Days 1 to 30 | CLM lead and process owners | Verified event feed for one contract type | Go only when timestamps reconcile |
| Days 31 to 60 | Finance, legal operations, and functional analysts | Baseline model and target set | Go only when costs and benefits avoid double counting |
| Days 61 to 90 | BI lead and executive sponsors | Role-based dashboards and readout | Go only when each claim has an owner and confidence tier |
BoloSign supports the operational layer by letting teams create, send, and sign PDFs, templates, and forms instantly, while AI-powered automation can assist with drafting, contract intelligence, review, negotiation, and compliance workflows. For global programs, validate the controls that apply to your environment, including ESIGN, eIDAS, HIPAA, and GDPR. Under eIDAS, electronic signatures have simple, advanced, and qualified levels, and a qualified electronic signature has the legal effect of a handwritten signature across the EU when backed by the required qualified certificate and signature creation device. (eIDAS signature levels)
Start Monday by assigning the owner, choosing one contract type, and writing the go or no-go gate before anyone builds a dashboard. Then use BoloSign's fixed-price model and unlimited usage to test contract automation across staffing, healthcare, real estate, logistics, education, and professional services without letting document volume distort the cost baseline.
BoloSign gives teams a simple way to create, send, and sign PDFs, templates, and forms, with AI contract review, contract intelligence, secure eSignature, and compliance support for ESIGN, eIDAS, HIPAA, and GDPR. Visit BoloSign to start a 7-day free trial and measure a real workflow from intake to signed agreement.

Paresh Deshmukh
Co-Founder, BoloForms
18 Oct, 2026
Take a Look at Our Featured Articles
These articles will guide you on how to simplify office work, boost your efficiency, and concentrate on expanding your business.